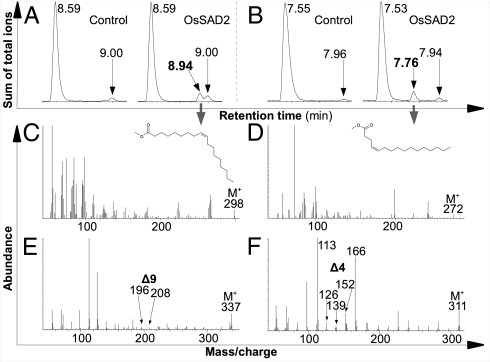
Fig. 3.
GC/MS analysis of OsSAD2 desaturase assay. (A, C, and E) 12,12-2H2-18:0-ACP substrate. (B, D, and F) 7,7,8,8-2H4-16:0-ACP substrate. (A and B) GC trace showing assay without desaturase (control; Left) and with desaturase (Right), with retention times (minutes) indicated. Left peak, substrate; right peak, background FA; second peak (with desaturase only), specific reaction product. (C and D) MS fragmentation patterns of specific FAME peaks marked by a gray arrow in A and B, showing mass ion and depicting the molecular structure. (E and F) MS fragmentation patterns of pyrrolidine derivatives of FAMEs in C and D. Arrows indicate ions that are diagnostic for the double-bond positions inferred. This analysis confirms Δ9 and Δ4 double-bond positions for 18:1 and 16:1 reaction products, respectively.

