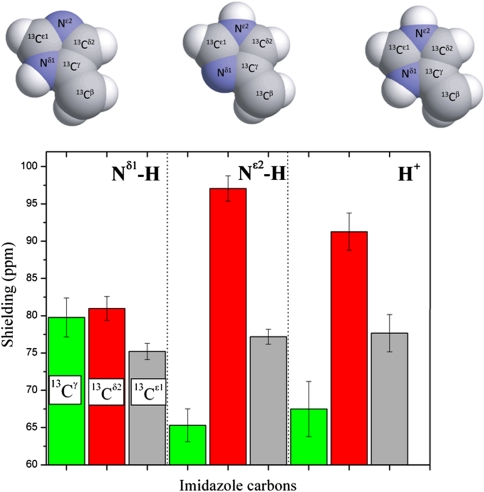
Fig. 1.
(Top) Space-filling-sphere representation of the forms of the imidazole ring of His: Nδ1-H, Nϵ2-H, and H+. (Bottom) Bar diagram of the computed shielding values for each carbon of the imidazole ring of His for each of the two tautomers: Nδ1-H, Nϵ2-H, and for the H+ form in the model tripeptide Ac-GHG-NMe. For each carbon of the imidazole ring, the height of the bar represents the mean value, σ∘, of the Gaussian function that fits the histogram of the computed shielding distribution for each of ∼35,000 conformations of histidine in the model tripeptide, and the vertical lines at the top of the bars the corresponding standard deviations (see Materials and Methods). Green, red, and gray colors indicate the results obtained for the  ,
,  , and
, and  nuclei, respectively.

