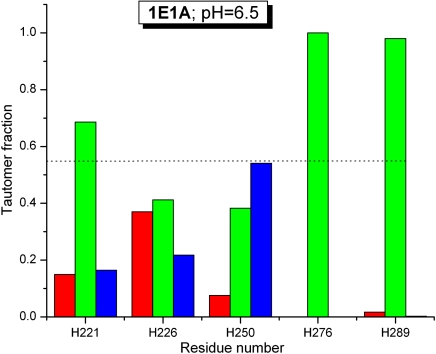
Fig. 2.
Fraction of tautomeric distribution for each of five out of six His residues of protein 1E1A, for which the chemical shifts were determined in solution at pH 6.5. Red and blue bars represent the fraction of the Nϵ2-H and Nδ1-H tautomer, respectively, and the green bars the fraction of the protonated form, H+. The dotted horizontal line indicates the fraction of the H+ form that a free His residue would have in solution at pH 6.5.

