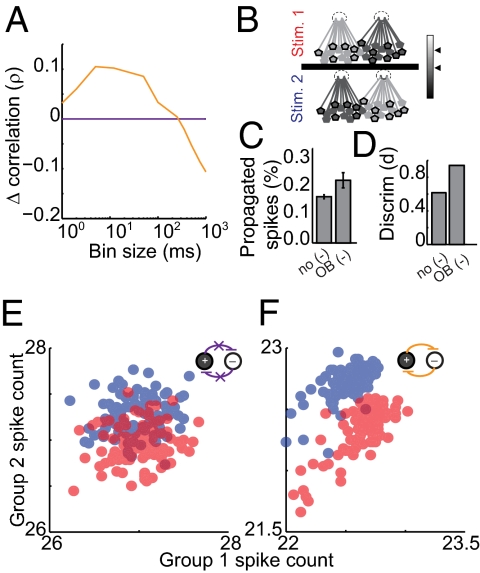
Fig. 3.
The olfactory bulb model replicates timescale-dependent correlation changes, which improves both propagation and encoding. (A) Cross-timescale correlation changes for the olfactory bulb model (orange) and the model with no inhibitory coupling (purple). (B) Stimulus generation: For stimulus 1 (Upper) one subpopulation received higher-magnitude DC stimulation (Left, light gray shading) whereas the other subpopulation received lower-magnitude DC stimulation (Right, dark gray shading). Stimulus 2 (Lower) reversed which subpopulation received the higher- and lower-magnitude stimulation, respectively. The mean activity of two randomly selected groups—group 1 (black outlines) and group 2 (no outlines)—was monitored. (C) Percentage of propagated spikes and (D) stimulus discriminability for both model variants are shown. (E and F) Average firing rate in group 1 (x axis) and group 2 (y axis) during stimulus 1 (red) and stimulus 2 (blue). Each point represents mean firing rates over 500 ms in groups 1 and 2 for a single trial in the no-coupling model (E) and the olfactory bulb model (F).

