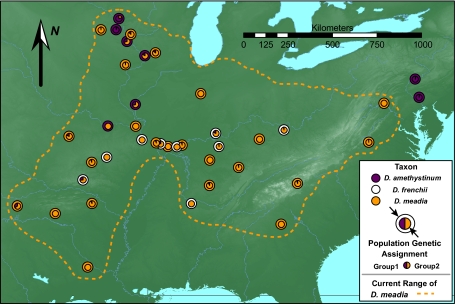
Fig. 1.
Distribution of samples, taxa, and inferred genetic groups. Outer circles at sampling localities represent taxonomic determinations. Inner circles at sampling localities show the average proportion within each population assigned to two genetic groups across 20 independent Bayesian clustering analyses of 1,182 AFLPs. Samples of rare taxa represent most of their distributions. Dashed line represents the approximate extent of the distribution of D. meadia.

