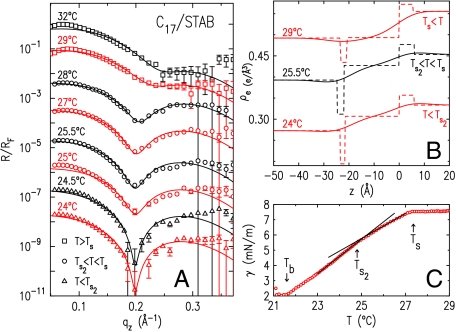
Fig. 4.
(A) Measured (symbols) and model-fitted (lines) XR curves of the l/l interface of C17 and 0.16 mM STAB solution. (B) Best-fit electron density profiles with (solid lines) and without (dashed lines) capillary wave smearing. (C) Measured (symbols) γ(T). Fitted lines show the slope change at Ts2.

