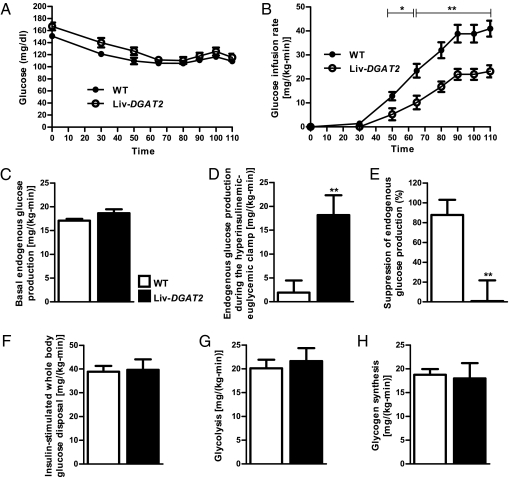
Fig. 1.
Liv-DGAT2 mice have severe hepatic insulin resistance. (A) Glucose time course during the hyperinsulinemic-euglycemic clamps. (B) Glucose infusion rates during the clamps. (C) Basal endogenous glucose production. (D) Endogenous glucose production during the hyperinsulinemic-euglycemic clamp. (E) Suppression of endogenous glucose production during the hyperinsulinemic-euglycemic clamps. (F) Insulin-stimulated whole-body glucose disposal. (G) Glycolysis. (H) Glycogen synthesis. *P < 0.05 and **P < 0.01 vs. WT mice. Data are represented as mean ± SEM.

