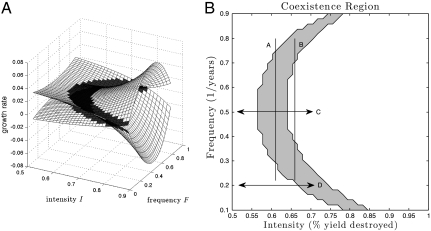
Fig. 1.
Coexistence region in the frequency-intensity plane. (A) Growth rate  for each species as a surface. Surfaces are shaded gray where both species have positive growth rates, which leads to stable coexistence. (B) Projection of coexistence region where
  for each species. Vertical lines indicate how different frequency DDRs [peaked on left (line A) and U-shaped on right (line B)] result from changing disturbance intensity. Horizontal arrows mark different intensity DDRs [peaked on top (C) and increasing on bottom (D)] that result from changing disturbance frequency. For clarity, we present a pair of species with symmetric life-history traits, which generate a symmetric coexistence region. Life-history parameters for (dominant, inferior) species: seed yield Y = (0.9,1.1), seedbank survival s = (0.4,0.6), germination rate G = (0.6,0.4), competition α = (1.1,0.9).

