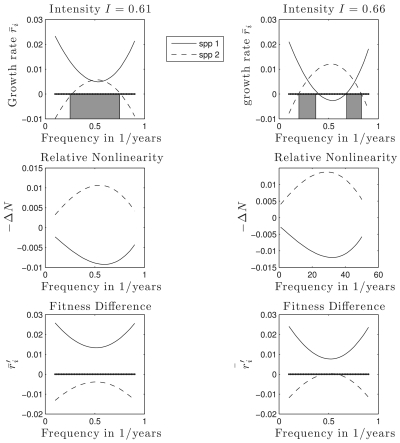
Fig. 3.
Long-term low-density growth rates ( ) as sum of relative nonlinearity (ΔN) and fluctuation-independent term (
 ). (Left) Mechanisms for a fixed intensity I = 0.61, corresponding to Fig. 1B line A. Coexistence occurs where
  is positive for both species, indicated by shaded regions. At intermediate frequencies, relative nonlinearity ΔN has the largest magnitude. (Right) At higher intensity (I = 0.66, corresponding to Fig. 1B line B), relative nonlinearity increases in magnitude, which disadvantages the competitive dominant at intermediate frequencies. Note the coexistence region (shaded rectangles) is split into disconnected components, and represents a U-shaped DDR. Life-history parameters for (dominant, inferior) species: seed yield Y = (0.9,1.1), seedbank survival s = (0.4,0.6), germination rate G = (0.6,0.4), competition α = (1.1,0.9).

