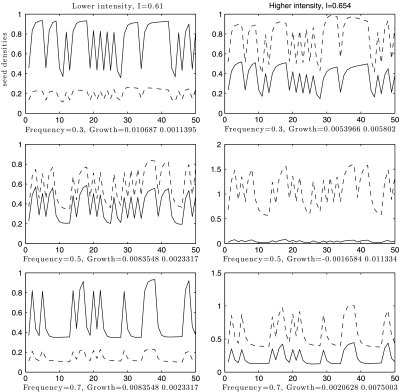
Fig. 4.
Density plots for a range of frequency and intensity parameters (F,I). (Left) (corresponding to line A in Fig. 1B) Coexistence occurs at all three frequencies. Note that species 2 has higher mean density at extremal frequencies. (Right) (corresponding to line B in Fig. 1B) Species 1 is forced to extinction (slowly) at intermediate frequencies, because the stronger negative effect of relative nonlinearity forces a negative growth rate ( ), as shown in Top Right of Fig. 3. Life-history parameters for (dominant, inferior) species: seed yield Y = (0.9,1.1), seedbank survival s = (0.4,0.6), germination rate G = (0.6,0.4), competition α = (1.1,0.9).

