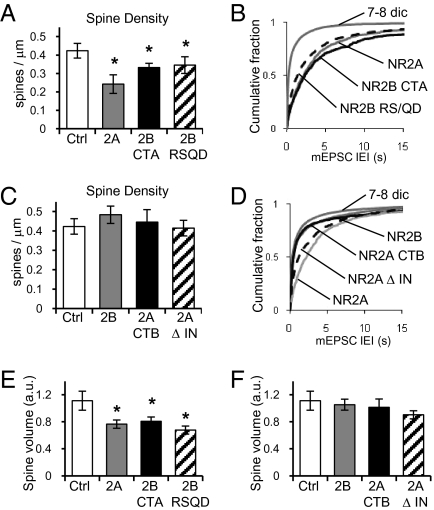
Fig. 5.
C termini of NR2 subunits control synaptogenesis and spine growth. (A) Quantification of dendritic spine density in control neurons (n = 8), neurons cotransfected with GFP, NR1, and NR2A (gray; n = 13), chimeric NR2B with the C terminus of NR2A (2B-CTA; black; n = 13), or NR2B RS/QD mutant (hatched; n = 15). (B) Cumulative fraction of IEIs of AMPAR-mediated mEPSCs from nontransfected neurons (n = 27) or neurons cotransfected with NR1 and NR2A (n = 7), NR1 and 2B-CTA (black; n = 8), or NR1 and NR2B RS/QD mutant (dashed; n = 8). NR2B-CTA reduces frequency compared with control cells (KS test D = 0.3794) and shows no difference with NR2A (KS test D = 0.0785). NR2B RS/QD decreases frequency compared with control (KS test D = 0.4286). (C) Quantification of dendritic spine density in control neurons (n = 8), neurons cotransfected with GFP, NR1, and NR2B (gray; n = 12), chimeric NR2A with the C terminus of NR2B (2A-CTB; black; n = 6), or NR2AΔIN mutant (hatched; n = 14). (D) Cumulative fraction of IEIs of AMPAR-mediated mEPSCs from nontransfected neurons (n = 27) or cotransfected with NR1 and NR2B (n = 8), NR1 and NR2A (n = 9), NR1 and 2A-CTB (black; n = 10), or NR1 and NR2AΔIN mutant (dashed; n = 8). NR2A-CTB recovers frequency and is not different from control cells (D = 0.0002) but different from WT NR2A (D = 0.36). NR2AΔIN partially recovers frequency (D = 0.1543 vs. NR2A). (E) Quantification of spine volume from control neurons (n = 5), or cotransfected with NR1 and NR2A (n = 7), NR1 and 2B-CTA (n = 7), or NR1 and NR2B RS/QD (n = 6). (F) Quantification of spine volume from control neurons (n = 5), or cotransfected with NR1 and NR2B (n = 4), NR1 and 2A-CTB (n = 6), or NR1 and NR2AΔIN (n = 7). Error bars represent SEM.

