Fig. 5.
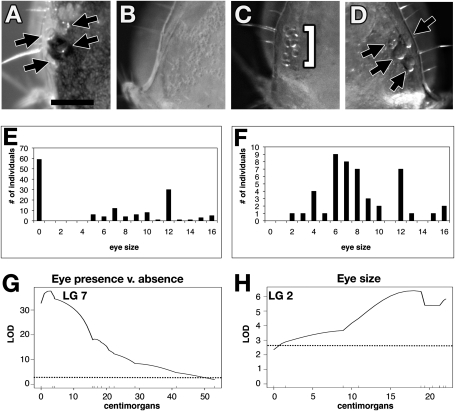
Eye size phenotypes and distribution in the backcross families. (A) A pigmented surface individual with four ommatidia. (B) A backcross individual with no external ommatidia. (C) A backcross individual with eight ommatidial fragments. (D) A backcross individual with four ommatidia. (E) Distribution of eye size for backcross families that have the eyeless phenotype. (F) Distribution of eye size for backcross families that do not have the eyeless phenotype. (G) Locus responsible for the qualitative phenotype of eye loss versus any sized eye using the binary method in R/qtl. Dotted line shows the genome-wide significance levels (α < 0.05) by permutation test, LOD = 2.41. (H) QTL for eye size in the families that have complete eye loss using Haley–Knott regression in R/qtl. Dotted line shows the genome-wide significance levels (α < 0.05) by permutation test, LOD = 2.42. Linkage group is listed at the top of the graph (G and H). (Scale bar: 0.125 mm; applies to A–D).

