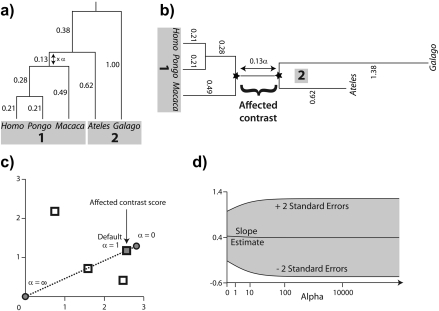
FIGURE 4.
Scaling the length of one branch by a factor of α. a) The split at the affected branch partitions the taxa into subtrees by separating the Homo/Pongo/Macaca clade (labeled 1) from Ateles and Galago (labeled 2). b) Each subtree is conceptually rooted at the proximal endpoint of the affected branch (indicated by black stars). Ancestral trait estimates are inferred at the root of each subtree, and the uniquely affected contrast is a scaled comparison of the 2 ancestral values. c) After rooting the tree on the affected branch, Felsenstein's algorithm yields 4 independent contrast scores (CiTX,CiTY), i = 1,2,3,4 (shown as squares): Homo versus Pongo, Homo/Pongo versus Macaca, Ateles versus Galago, and Homo/Pongo/Macaca versus Ateles/Galago. Only the last of these is a function of α (filled); the remaining 3 are invariant to the scale factor (hollow). The position of the affected contrast score in transformed coordinate space is constrained to be collinear with the origin (along the dotted line). Larger values of α decrease the importance of the affected contrast score in the linear regression by shifting its position toward the origin. d) The regression slope estimate  is shown as α ranges from zero toward infinity on a logarithmic scale. Confidence bounds are given by the upper and lower curves that plot
  and
and , respectively (SE, standard error).

