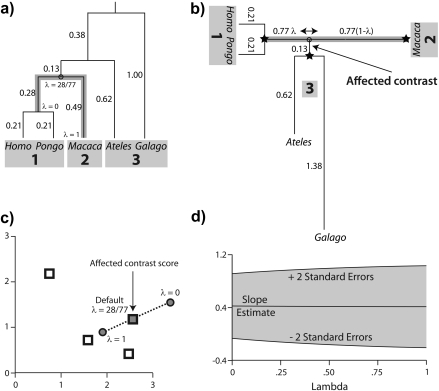
FIGURE 5.
Locally regrafting a subtree. a) The sliding subtree (Ateles/Galago, labeled 3) meets the 2 rigid subtrees (Homo/Pongo, labeled 1; Macaca, labeled 2) at an internal node (hollow circle). Subtrees 1 and 2 are connected by a branch of total length 0.77; regrafting subtree 3 to this branch places it at a point 0.77λ and 0.77(1 − λ) units away from subtrees 1 and 2, respectively. b) Ancestral trait estimates are inferred at the root of each subtree as indicated by black stars. The value imputed at the hollow circle is a ω-weighted average of the estimates from subtrees 1 and 2 (see Equation (19)). The uniquely affected contrast is a scaled comparison of this weighted average to the ancestral trait estimate from subtree 3. c) After rooting the tree on the affected branch, Felsenstein's algorithm yields 4 independent contrast scores, only one of that is affected by λ (filled square; see Fig. 4c). The position of the affected contrast score in transformed coordinate space is determined by ξ and ω, both of that are functions of λ. ξ acts as a scale factor akin to α from branch scaling, whereas ω contributes a degree of nonlinearity to the trajectory of the affected contrast score (dotted line). d) The regression slope estimate  is shown as λ ranges from zero to one. Confidence bounds are given by the upper and lower curves that plot
  and
and  , respectively.

