
Figure 6.
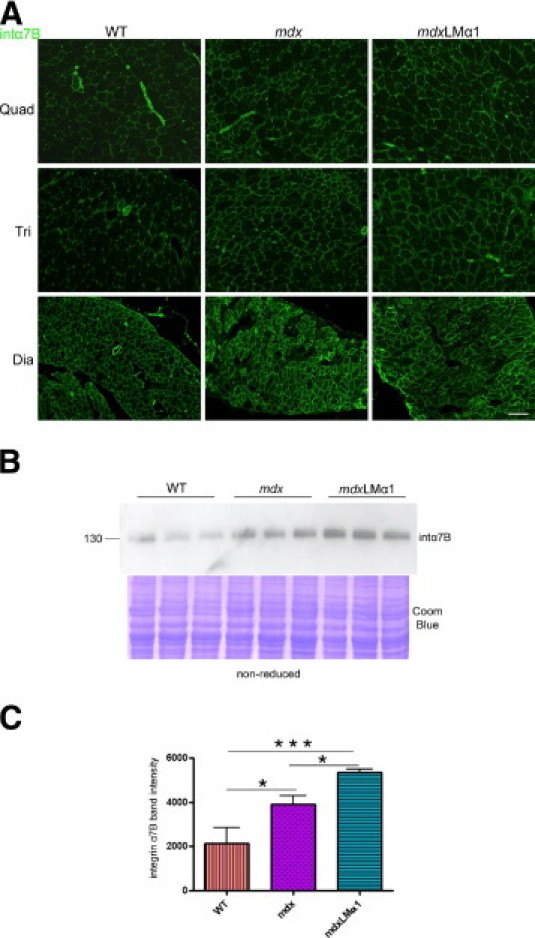
Analyses of integrin α7B expression in wild-type, mdx, and mdxLMα1 mice. A: Immunostaining reveals upregulation of integrin α7B in mdx and mdxLMα1 muscles. Quadriceps, triceps brachii, and diaphragm are shown. Scale bar = 100 μm for all images. B and C: Immunoblotting of skeletal muscle tissue extracts (nonreducing conditions) from wild-type (n = 3), mdx (n = 3), and mdxLMα1 mice (n = 3) using integrin α7B antibody. Densitometric analysis confirms significant upregulation of integrin α7B in mdx and mdxLMα1 vs wild-type mice (1.8 fold, *P < 0.05; 2.5-fold, ***P < 0.0001, respectively). Additionally, moderate increase of integrin α7B was noted in mdxLMα1 limb muscles, compared with mdx muscles (1.4 fold, *P < 0.05). Coomassie Blue staining was shown to demonstrate equal loading. One-way analysis of variance followed by Bonferroni's multiple comparison test was used for statistical analysis. Results are reported as means ± SD.