
Figure 3.
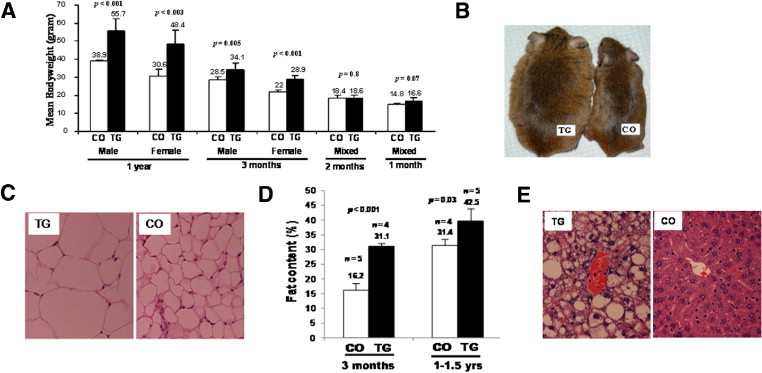
The mMT-hOGG1 TG mice developed obesity and hepatosteatosis. A: Changes in body weights of both sexes of mMT-hOGG1 TG and wild-type control mice (CO). The bars indicate the mean ± SE (n = 6 mice). For mice aged 1 and 2 months, six TG and CO included both males (n = 3) and females (n = 3) (mixed) because there was no difference in body weight between the sexes at these ages. B: Spontaneous obesity in an mMT-hOGG1 TG mouse (weight, 63 g) compared with CO (weight, 34 g), photographed at the age of 1 year. C: Increased volume of lipocytes in an abdominal fat pad from an mMT-hOGG1 TG mouse compared with that from CO (×400 magnification). D: Increased total fat content in mMT-hOGG1 TG mice compared with CO at the ages of 3 months and 1 to 1.5 years. Total fat content was measured by dual-energy X-ray absorptiometry. Scale bars indicate the mean ± SE (n = 4 to 5 mice). E: Marked hepatosteatosis in the liver from an mMT-hOGG1 TG mouse compared with that from CO (×400 magnification).