
Figure 1.
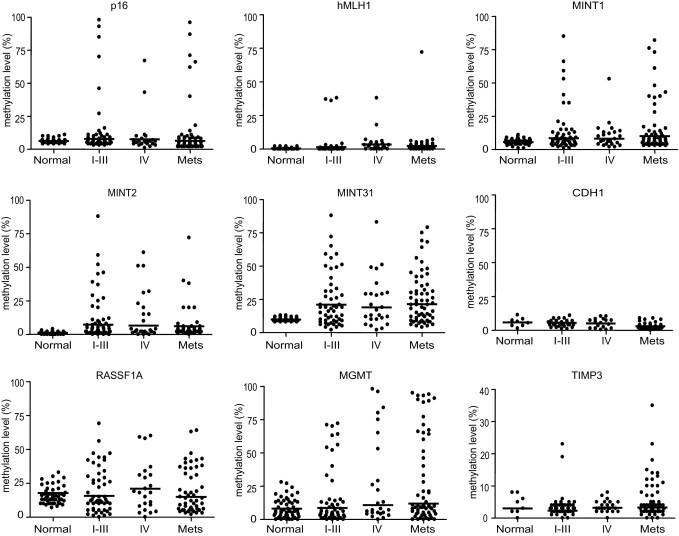
DNA methylation status of nine genes (p16, hMLH1, MINT1, MINT2, MINT31, CDH1, RASSF1A, MGMT, and TIMP3) in 53 stage I–III CRCs (I–III), 25 stage IV CRCs (IV), and 62 liver metastases (Mets) and corresponding normal colonic mucosae. The y axis indicates the level of DNA methylation of each gene, as measured by bisulfite pyrosequencing–based methylation analysis. Each dot represents the methylation level of the indicated gene in each sample from either primary CRCs of a differing stage or liver metastases. Horizontal lines denote median methylation levels in each group.