
Figure 4.
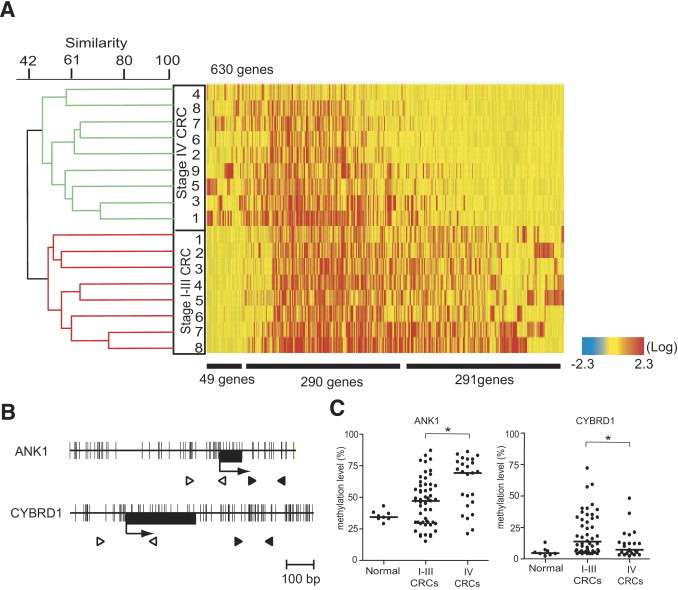
Dendrogram and heat map overview of unsupervised hierarchical cluster analysis of DNA methylation data from stage I–III CRCs and stage IV CRCs using 630 genes. A: Commonly methylated genes in either stage I–III CRCs or stage IV CRCs are analyzed. Each cell in the matrix represents the DNA methylation status of a gene in an individual sample. Red and blue in cells reflect high and low methylation levels, respectively, as indicated in the scale bar (log2-transformed scale). Numbers below the matrix indicate the methylated genes frequently found in stage IV CRCs, in both stage I–III CRCs and stage IV CRCs, and in stage I–III CRCs, respectively. The dendrogram represents the same as Figure 3. B: Schematic diagrams of the promoters of the ANK1 and CYBRD1 genes. The transcription start site (arrow) and the location of exon 1 (black box) are indicated. Black and white arrowheads indicate the regions analyzed by pyrosequencing and MSP, respectively. C: DNA methylation status of the ANK1 and CYBRD1 genes in 8 normal tissues, 53 stage I–III CRCs, and 25 stage IV CRCs. Scatterplot represents the same as Figure 1. DNA methylation levels were statistically analyzed between stage I–III CRCs and stage IV CRCs. *P < 0.05.