
Figure 2.
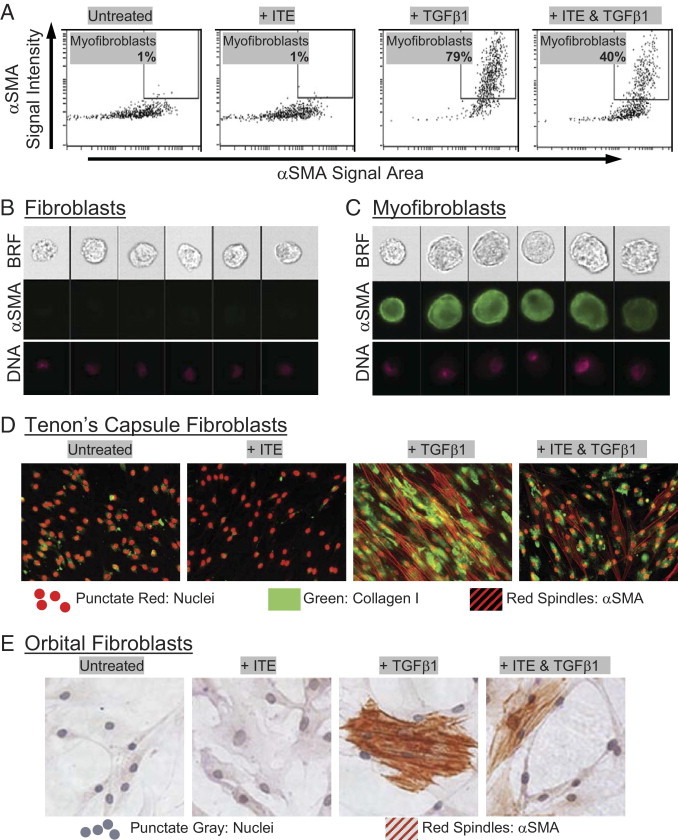
Cellular imaging confirms that ITE attenuates TGFβ1-induced myofibroblast differentiation. (A–C) Human orbital fibroblasts were treated with TGFβ1 (1 ng/mL) and ITE (1 μmol/L) for 96 hours. They were then fixed with methanol and stained for α-SMA using a FITC-conjugated antibody and analyzed on an Amnis ImageStream imaging flow cytometer. Live single cells were identified as described in Materials and Methods. A: Myofibroblasts were distinguished from fibroblasts based on the intensity (y axis) and area (x axis) of α-SMA staining. Numerical percentage value on each dot-plot refers to the percentage of cells contained within the myofibroblast region. Representative images of cells from both (B) outside and (C) inside the myofibroblast region are shown. Image panels show brightfield (BRF), α-SMA (green), and nuclei (DNA) stained with Draq5 (pink). D: Tenon's capsule fibroblasts were treated with TGFβ1 (1 ng/mL) and ITE (1 μmol/L) for 96 hours. Cells were stained with antibodies specific for collagen I and α-SMA then counterstained with TO-PRO−3 iodide to detect nuclei. Green staining indicates the presence of collagen I. Red spindles represent positive staining for α-SMA. Nuclei are also stained red, but they can easily be distinguished morphologically from α-SMA. E: Primary cultures of human orbital fibroblasts were treated with TGFβ1 (1 ng/mL) and ITE (1 μmol/L) for 96 hours. Cells were stained with α-SMA antibody and counterstained with hematoxylin. Red spindles represent positive staining for α-SMA. Magnification, ×200.