
Figure 3.
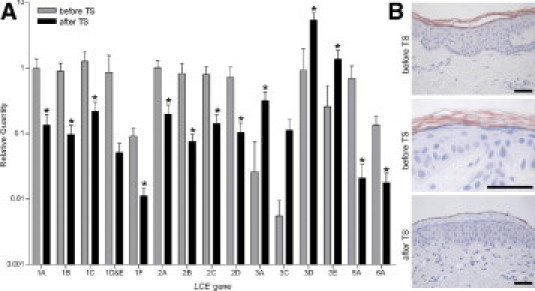
LCE expression before and after tape stripping in normal skin. A: Relative mRNA expression levels of LCE genes in epidermal sheets of healthy control individuals before and after tape stripping (TS) (N = 5). All values were expressed relative to LCE1A in skin to enable comparison of expression levels between genes. *P < 0.05 compared with before tape stripping [mean (SD)]. B: Immunohistochemical staining with the pan-LCE2 antibody on sections of normal skin before tape stripping (upper and middle panels), before enlarged (middle panel), and 48 hours after tape stripping (lower panel). Each illustration is representative of data for five different individuals. Scale bar = 50 μm.