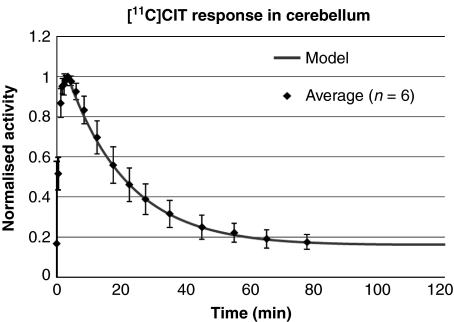
Figure 1.
The response of [11C]CIT in cerebellum was modeled from TACs from six previous experiments where the tracer was administered as an intravenous bolus. Error bars indicate standard deviation. The model curve was used to calculate the infusion scheme required to achieve pseudo steady state of tracer in cerebellum.

