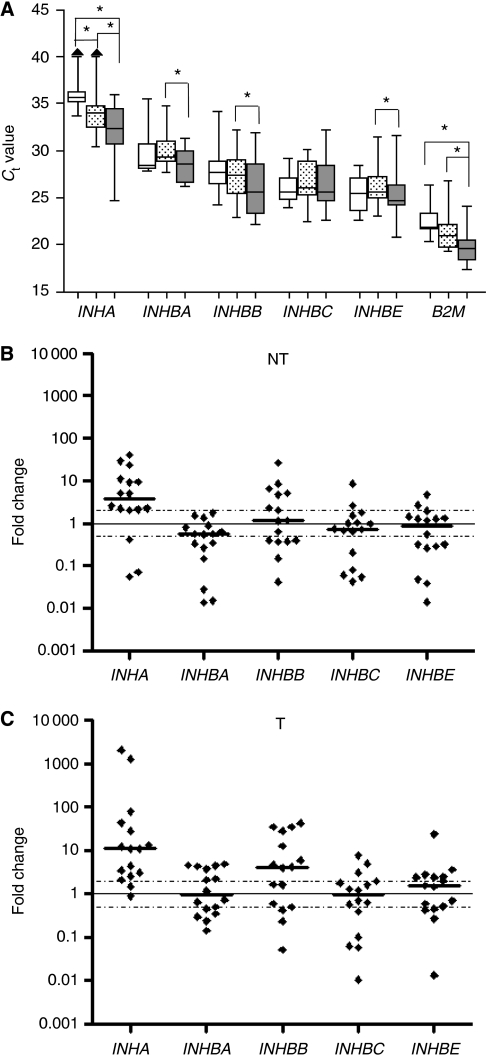
Figure 1.
mRNA expression of inhibin genes in disease-free (N), and tumour-adjacent (NT) liver and in HCC (T). (A) Real-time PCR cycle threshold (Ct) values normalised to RNA input are given. Ct values for B2M are shown for comparison. Boxes (blank, N; dotted, NT; grey; T) represent the lower and upper quartiles with medians; whiskers illustrate the 10–90 percentiles of the samples. Significant changes (P<0.05) are marked with brackets and asterisk. (B and C) Expression changes of individual NT or T samples related to the median of normal liver (N). Log transformed Ct values were used. Dotted lines indicate expression changes to >2-fold or <0.5-fold, considered as thresholds of biological relevance. INHA levels in three N and one NT samples were undetectable and for calculations were set at the detection limit (Ct 40).

