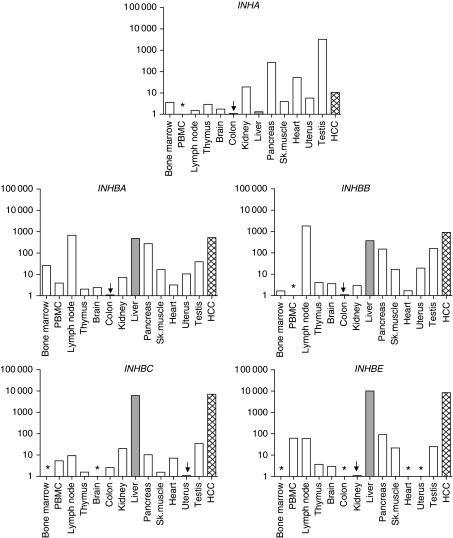
Figure 3.
Expression of inhibin subunits in human tissues. Ct values detected in the various tissues ranged from 24.0 to 36.0 for INHA, for INHBA from 27.5 to 37.0, for INHBB from 24.5 to 35.5, for INHBC from 26.0 to 38.5 and for INHBE from 24.5 to 36.5. Expression below detection limits is marked by asterisks. The respective lowest expressing tissue (arrow) was used as calibrator and set 1, the expression levels of the others were depicted as fold increase in logarithmic scale. Disease-free liver is shown in grey, HCC expression levels by gridded bars. PBMC, peripheral blood mononuclear cells.

