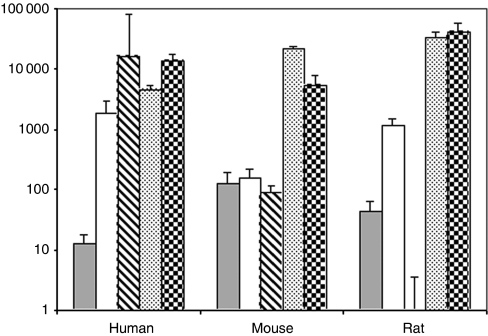
Figure 4.
Species comparison of inhibin family expression in liver tissues. The lowest expressed gene, rat INHBB (Ct 37.5), was used as calibrator and set 1, the expression levels of the other genes were depicted as fold increase in logarithmic scale. Equal sensitivities of the Taqman assays were confirmed by plasmid dilution experiments (not shown). Expression ratios are depicted as following, INHA (grey bars), INHBA (open bars), INHBB (striped bars), INHBC (pointed bars) and INHBE (gridded bars).

