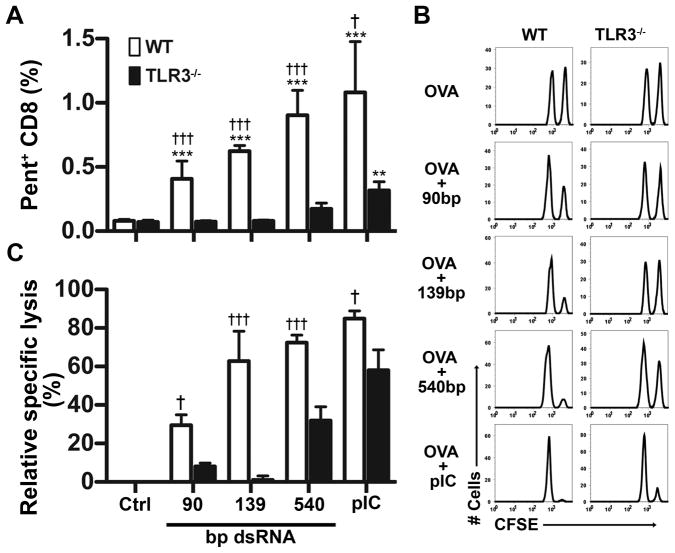
Figure 6. In vivo CTL induction by dsRNA.
WT and TLR3−/− mice were immunized with OVA alone (Ctrl) or OVA plus the indicated dsRNA ON or pIC. (A) Percentages of OVA-specific (pentamer positive) CD8+ T cells seven days after immunization. (B) Representative histograms showing in vivo cytotoxicity assay. Six days after immunization mice were injected with OVA peptide- coated target cells labeled with high amounts of CFSE and control cells labeled with low amounts of CFSE. One day later cytotoxicity was detected as a loss in CFSE bright cells relative to CFSE dull cells. (C) Percent specific lysis. Data are from at least 3 mice per group (mean + SEM). * designates significant differences compared to control (**P<0.01; ***P<0.001), whereas † indicates significant differences between WT and TLR3−/− mice (†P<0.05; †††P<0.001).

