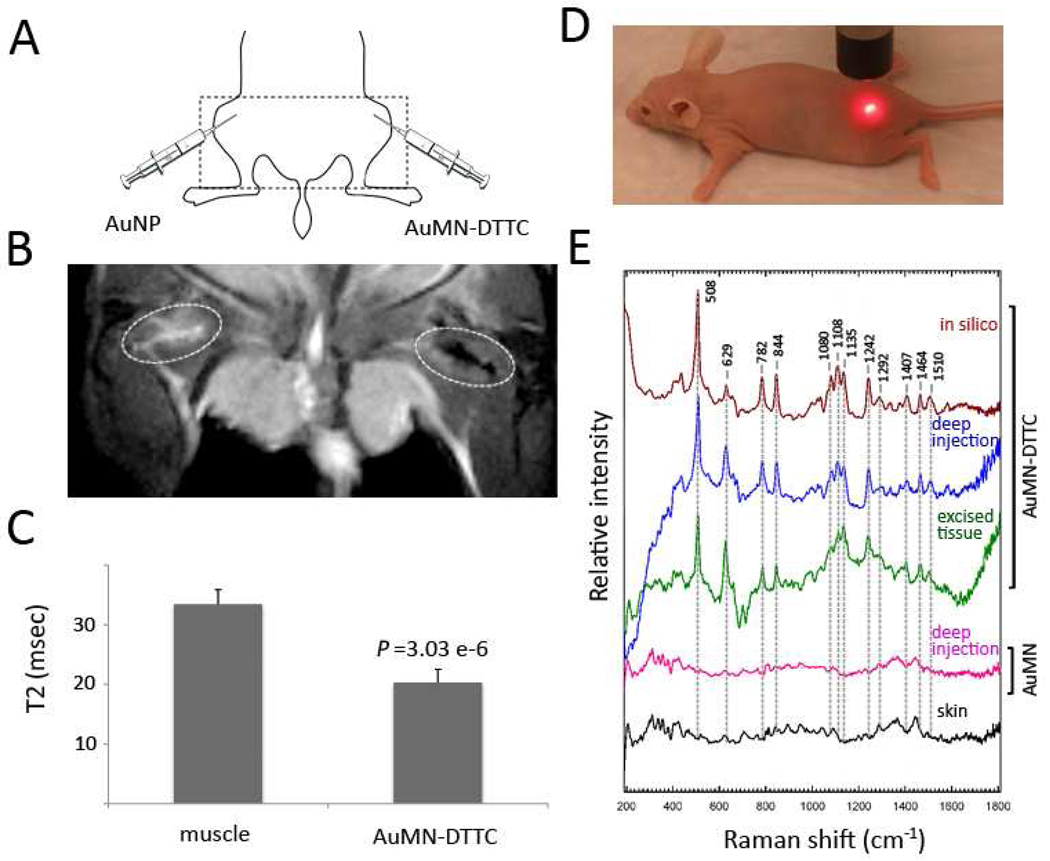
Figure 6. MRI and Raman spectroscopy in vivo.
A) A schematic of the probe injection set-up. The experimental AuMN-DTTC probe was injected in the deep right gluteal muscle. A control probe was injected in the contralateral muscle. B) in vivo T2 weighted MR image of a mouse injected intramuscularly (i.m.) with AuMN-DTTC and the control probe, AuNP. There is a notable loss of signal intensity associated with the site of the AuMN-DTTC injection, confirming the suitability of the probe as an in vivo MRI contrast agent. C) Calculated T2 values based on multiecho T2-weighted MRI. The T2 relaxation time of AuMN-DTTC was significantly lower than both non-injected muscle and muscle injected with AuNP (n = 3; Student’s t-test; p < 0.05). C) A photograph demonstrating the Raman spectroscopy experimental set-up. E) in vivo Raman spectra of a mouse injected i.m. with AuMN-DTTC and the control probe, AuMN. The in vivo Raman spectrum of muscle injected with AuMN-DTTC has a clear SERS signature, which is indistinguishable from that obtained ex vivo and in silico and absent in skin tissue and in muscle injected with the control probe.

