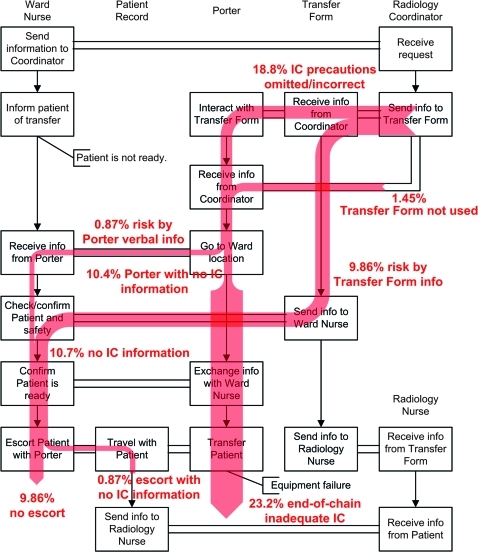
Figure 3.
A distribution of trajectories for the infection control scenario indicates the increasing risk associated with lack of adequate infection control in the in-patient transfer process. The boxes indicate the important steps in the policy of the patient transfer process, vertical arrows indicate chronology, and horizontal channels indicate information transfer between the six agents. The shaded trajectories indicate the presence of risk at each point in the process, and percentages indicate the proportion of the completed simulations that are associated with risk along the given trajectory. IC, infection control.

