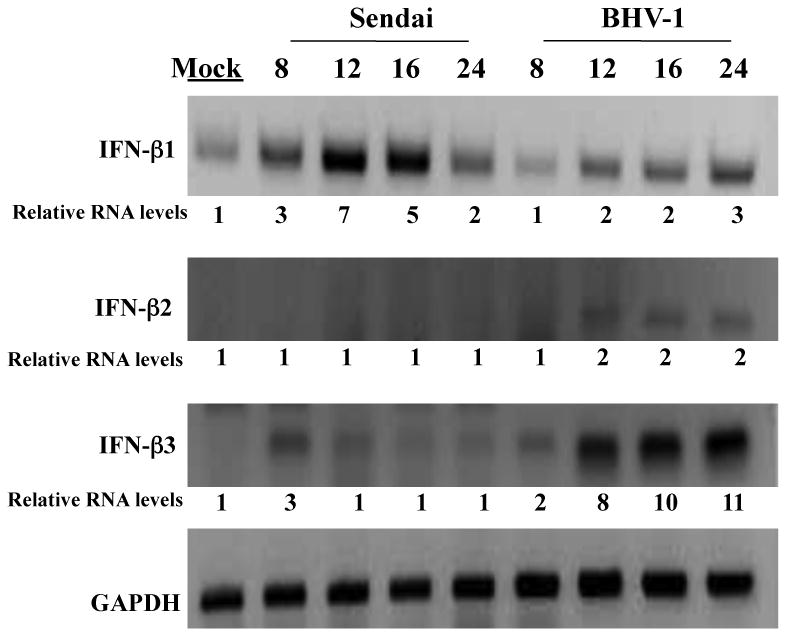
Figure 1. Analysis of IFN-β levels in established bovine cells infected with BHV-1 or Sendai virus.

Established bovine kidney cells (CRIB) were mock infected or infected with BHV-1 (moi = 5) or Sendai virus (40 HA U/mL) for the designated length of time (hours). Total RNA was extracted for each sample and cDNA synthesis performed as previously described (Perez et al., 2008). The bovine IFN-β specific primers used for PCR reactions were previously described (Perez et al., 2008), see materials and methods for the sequences of the primers that were used. These results are representative of at least three independent studies. The numbers below the respective panels are relative intensities of the amplified bands. The values from the respective bands were obtained using a Bio-Rad Molecular Imager FX (Molecular Dynamics, CA). The value obtained from the mock-infected sample was arbitrarily set at 1.
