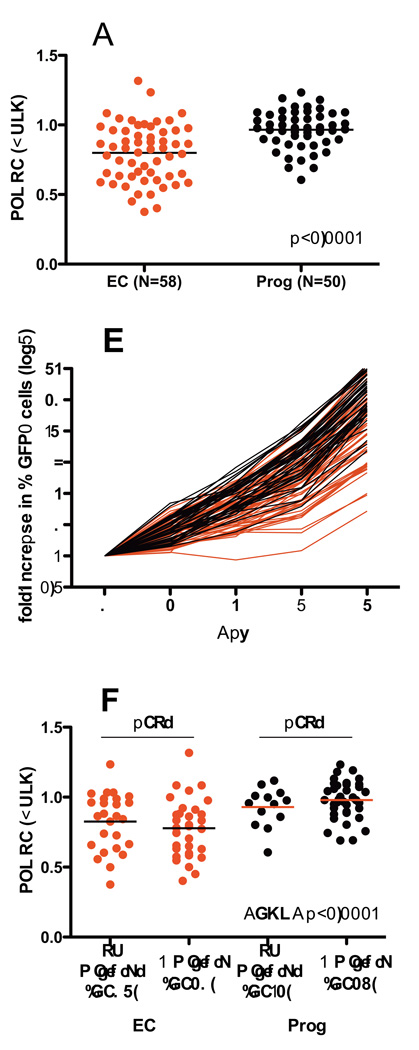
Figure 2. Replication Capacities of bulk RT-Integrase recombinant viruses derived from elite controller and chronic progressor sequences.
Panel A: RC of bulk RT-Integrase recombinant viruses from controllers (EC) and Progressors (Prog) are shown. RC values are normalized to the mean RC of NL4-3, such that an RC of 1.0 indicates equivalent growth to NL4-3, while RC >1 and RC <1 indicate faster or slower growth compared to NL4-3, respectively. Results represent the average of three independent experiments. Horizontal bars indicate median values for each group. Panel B: The rate of viral spread in culture (expressed as fold-increase in % GFP+ cells over the assay period) is shown for controller-derived (red lines) vs. progressor-derived (black lines) viruses. Panel C: RC results of bulk RT-Integrase recombinant viruses are stratified by the absence or presence of amino acid mixtures in the chimeric viral stocks. No significant difference in RC was observed between non-mixture-containng vs. mixture containing recombinant viruses derived from controllers or progressors.

