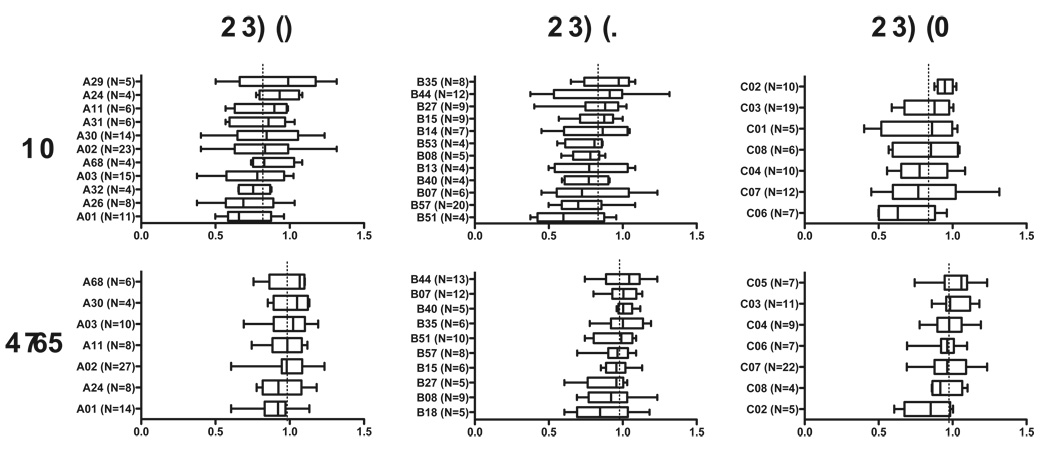
Figure 3. Associations between HLA class I allele expression and Replication Capacities of RT-Integrase recombinant viruses.
Box and whisker plots indicate the median (line), interquartile range (box) and range (whiskers) of viral RC, stratified by HLA class I alleles expressed. Asterisks indicate observations that trend higher or lower than the population mean, with p<0.1 (Wilcoxon Rank-sum test). Dotted vertical line indicates median replication capacity for each patient group. HLA class I alleles with a minimum of N=4 observations are shown.

