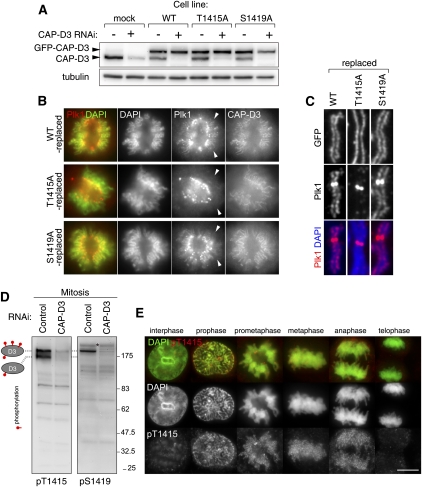
Figure 4.
Mitotic phosphorylation of CAP-D3 on Thr 1415 and Ser 1419. (A) Replacement of endogenous CAP-D3 protein with GFP-tagged CAP-D3 proteins. HeLa cells that stably express GFP-tagged GFP-D3, either wild-type (WT) or the nonphosphorylatable mutant for Thr 1415 (T1415A) or Ser 1419 (S1419A), were generated. Expression of endogenous CAP-D3 was suppressed by RNAi designed to target the untranslated region of the gene. Interphase cell extracts were analyzed by immunoblotting for the amount of endogenous CAP-D3 (bottom bands) and GFP-CAP-D3 (top bands). (B) Delocalization of Plk1 from chromosome axes in T1415A-replaced cells. Wild-type-replaced, T1415A-replaced, or S1419A-replaced cells were fixed and stained with Plk1 antibodies (red). DNA was stained with DAPI (green). Representative prometaphase cells are shown. Note that T1415A and S1419A were both found enriched at chromosomal axes at levels comparable with the wild-type version, which discounts the possibility that these phosphorylations have a major role in the chromosomal association of condensin II. (C) Enrichment of Plk1 at chromosome axes is perturbed in T1415A-replaced cells. Fixed chromosome spread samples prepared from mitotic cells that had been replaced with the indicated version of CAP-D3 were stained with Plk1 antibodies. Quantification of fluorescence intensities for Plk1 signals is shown in Supplemental Figure 5B. (D) Generation of phospho-specific CAP-D3 antibodies. Total extracts of nocodazole-arrested cells treated with either mock (control) or CAP-D3 RNAi were subjected to immunoblotting by pT1415 or pS1419 antibodies. Note that two major pT1415 reactive bands and one major pS1419 reactive band (as denoted on the left side) are diminished in CAP-D3-depleted cells. Bands that do not disappear after CAP-D3 depletion are nonspecific reactive proteins (a band marked by an asterisk, for example). Specific reactivity to phospho-sites and mitotic forms are later shown in Supplemental Figure 6, A and B, respectively. (E) Timing of CAP-D3 Thr 1415 phosphorylation during mitotic progression. Fixed HeLa cells were stained with pT1415 antibodies and labeled with an Alexa dye (red). DNA was stained with DAPI (green). Representative pictures of interphase, prophase, prometaphase, metaphase, and early and late anaphases are shown. Bar, 10 μm. For p1419 staining, see Supplemental Figure 6B.

