Figure 7.
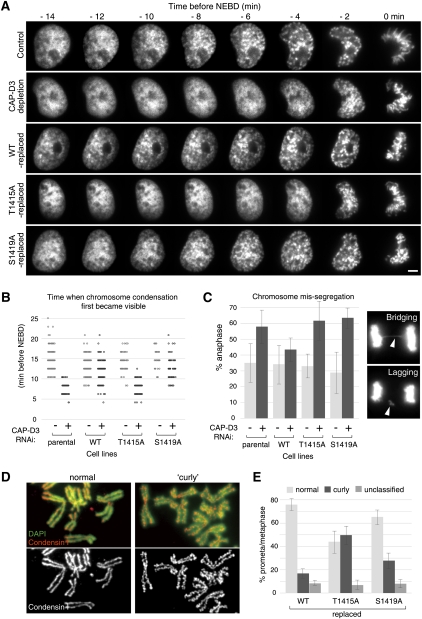
Nonphosphorylatable CAP-D3 mutants defective in mitotic functions of condensin II. (A) Analysis of the initial phases of chromosome condensation in live cells. Prophase image sequences were aligned on the time axis according to time before NEBD, which is defined by loss of a defined nuclear boundary. Bar, 5 μm. (B) Quantification of chromosome condensation in prophase. Time (minutes before NEBD) when chromosome condensation first became recognizable was scored and plotted for the indicated live-cell recordings. (C) Analysis of defective chromosome segregation in anaphase in nonphosphorylatable CAP-D3 mutants. During live-cell imaging analysis, anaphase cells were assessed for the presence of lagging and/or bridging chromosomes, as exemplified in the panels on the right. Mean ± SD from three experiment replicates (n = 20∼30 cells per experiment) are shown in the histogram. Similar results were obtained in a fixed-cell analysis (Supplemental Fig. 8). (D) Examples of chromosome spreads demonstrating normal (left panels) or curly (right panels) appearance. Chromosome spreads were prepared from cells that had been treated with a hypotonic buffer and stained with CAP-H (a condensin I subunit) antibodies (red). DNA was counterstained with DAPI (green). (E) Abnormal curly change of chromosomal axes in nonphosphorylatable CAP-D3 mutants. More than 100 cells per indicated condition were examined and scored based on their chromosomal axis appearance (mean ± SD).

