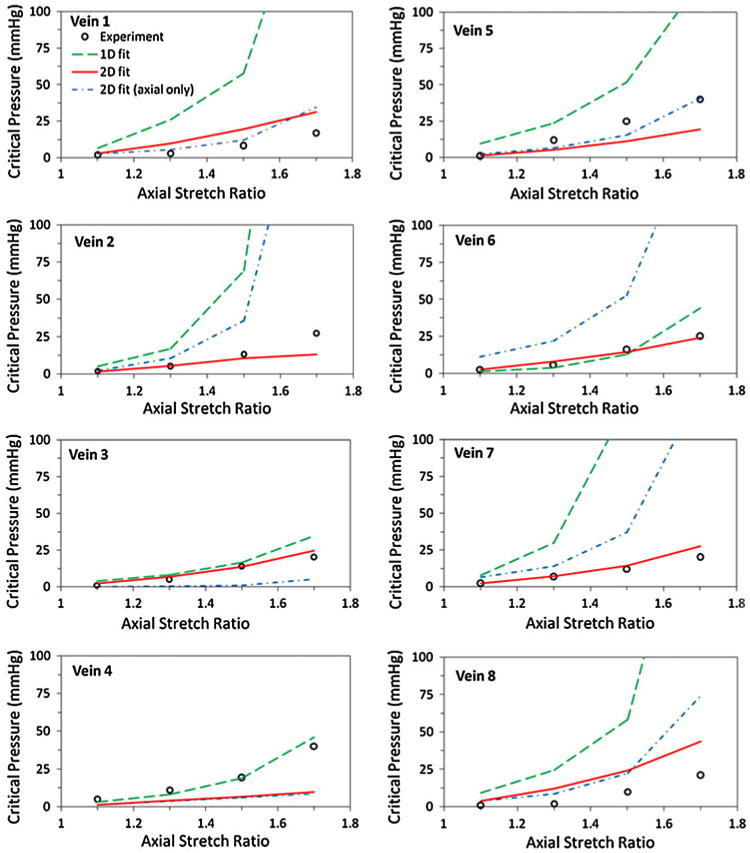
FIGURE 2.

Comparison of experimental and model predicted buckling pressures plotted as functions of the axial stretch ratio. The open circles represent the experimental buckling results.22 The solid line (2D fit) represents the buckling pressure predicted using the material constants obtained from simultaneous fitting of the circumferential and axial data. The dot-dashed line (2D fit, axial only) represents the buckling pressure predicted using the material constants from fitting the axial data only. These 2D material constants are listed in Table 1. The dashed line (1D fit) represents the 1D model predictions given in our previous paper.22
