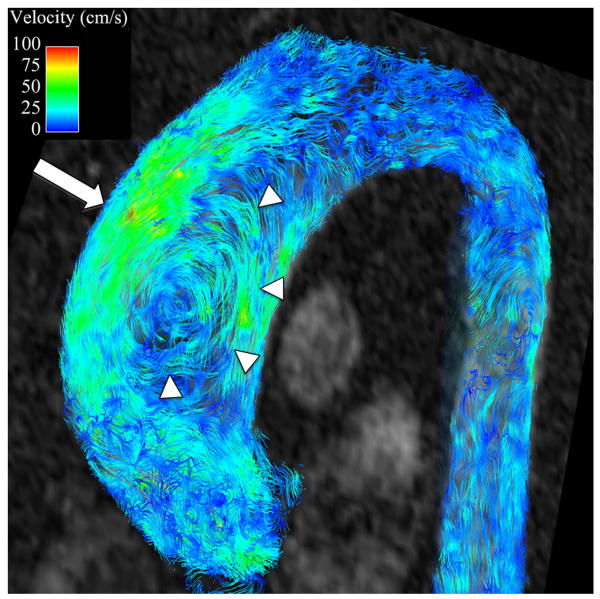
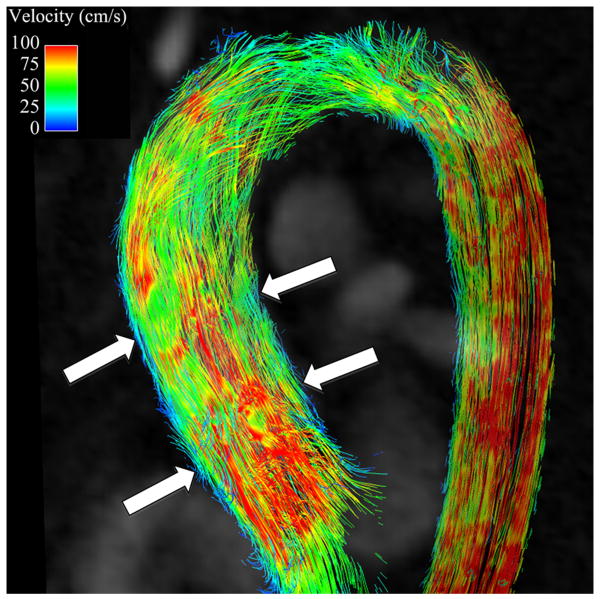
Figure 3.
Flow streamlines during peak systole in (A) a patient with an AscAA and (B) and normal healthy volunteer. In the patient with an AscAA (A), vortical flow (arrowheads) with higher velocities are present along the anterior surface of the aneurysm (arrow), corresponding to areas of highest wall shear stress. In the healthy volunteer (B), flow is laminar (arrows). without vortices and with relatively uniform velocity distribution around the aorta surface, corresponding to observed uniform distribution of wall shear stress values.


