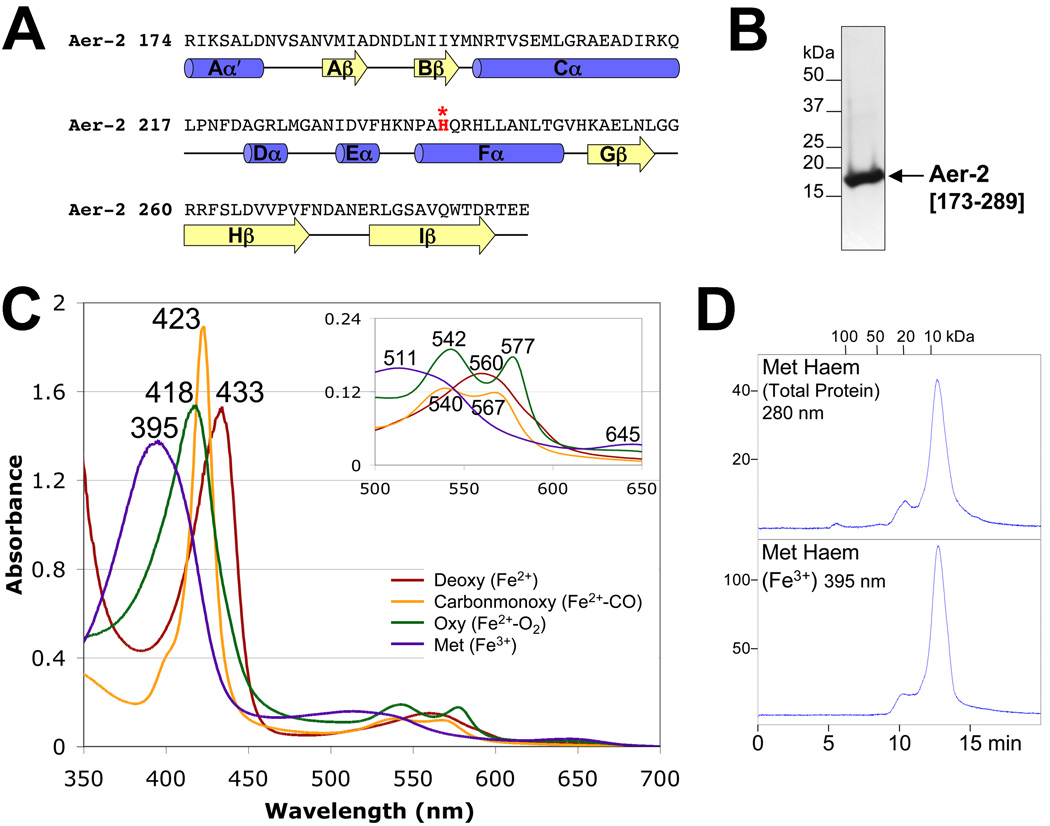
FIG. 4.
Aer-2 PAS secondary structure, spectra and oligomeric state. A. Sequence and secondary structure of the Aer-2 PAS domain as predicted by PSIPRED (http://bioinf4.cs.ucl.ac.uk:3000/psipred) and a PAS sequence alignment created by L. Ulrich and I. Zhulin (personal communication). α-Helices and β-strands are shown as blue cylinders and yellow arrows, respectively. Aer-2 PAS contains a histidine in the Fα3 position (highlighted red), which coordinates heme in the structures of DOS and FixL. B. Coomassie-stained SDS-PAGE gel of purified Aer-2 PAS protein (res. 173–289, 16.3 kDa). C. Absorption spectra of purified Aer-2 PAS protein in the reduced (deoxy, dark red line), oxidized (met, purple line), carbonmonoxide-bound (carbonmonoxy, orange line) and oxygen-bound (oxy, green line) states. The absorbance maximum at each peak is indicated. The insert shows an expanded view of peaks between 500 and 650 nm. D. Elution profile of isolated Aer-2 PAS protein in its met-heme state during size-exclusion chromatography. The elution profile is shown in arbitrary units at 280 nm to reveal total protein content (top panel) and at 395 nm to detect the elution of met-heme (bottom panel). Fractions were removed and analyzed by Western blotting; in all cases, the Aer-2 PAS protein co-eluted with the heme (not shown).

