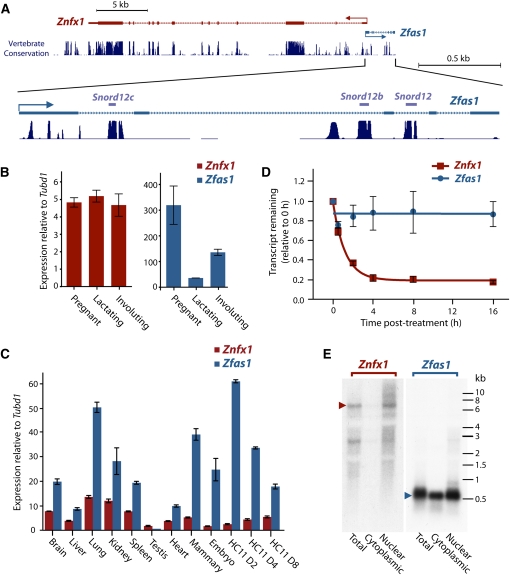
FIGURE 1.
Relationship and expression of Znfx1 and its associated ncRNA Zfas1. (A) Genomic context of Znfx1 and its associated ncRNA. The enlarged Zfas1 indicates the location of three snoRNAs derived from this gene. The high degree of conservation of these regions across mammalian species is indicated. (B) Relative expression of Znfx1 (left) and Zfas1 (right) in mammary epithelial cells during different developmental stages of mammary gland development to Tubulin delta 1 (Tubd1). Expression levels of three biological replicates for each stage were measured in triplicate by qPCR. (C) Relative expression profile of Znfx1 and Zfas1 to Tubd1 in different tissues by qPCR. Technical replicates were performed in triplicate for each sample. (D) Decay curve of Znfx1 and Zfas1 in N2A cells. Transcription was blocked by treatment with actinomycin D, and expression levels of three biological replicates were detected by qPCR. Error bars in B, C, and D are the standard error of the mean (SEM). (E) Northern blot analysis of Znfx1 and Zfas1 on RNA derived from total, cytoplasmic, and nuclear fractions of HC11 cells. Arrows indicate size of transcript for each gene.

