FIGURE 4.
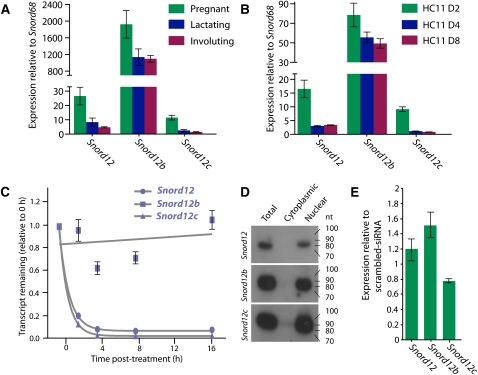
Expression of snoRNAs that are intronic to Zfas1. (A) Relative expression (from left to right) of Snord12, Snord12b, and Snord12c to Snord68 during different mammary gland developmental stages. Expression levels of three biological replicates for each stage were measured in triplicate by qPCR. (B) Expression levels (from left to right) of Snord12, Snord12b, and Snord12c during HC11 cell differentiation relative to Snord68. Expression levels of two biological replicates for each stage were measured in triplicate by qPCR. Error bars in both A and B are SEM of the biological replicates. (C) Decay curve of Snord12, Snord12b, and Snord12c in N2A cells. Transcription was blocked by treatment with actinomycin D, and expression levels were detected in triplicate by qPCR. Errors are the standard error of the mean (SEM). (D) Northern blot analysis of Snord12, Snord12b, and Snord12c (see Fig. 1A and Supplemental Fig. S3 for genomic positions) expression in total, cytoplasmic, and nuclear RNA derived from undifferentiated HC11 cells. (E) Expression levels of Snord12, Snord12b, and Snord12c, normalized to Snord68, in undifferentiated (day 2) HC11 cells transfected with Zfas1 siRNA relative to expression levels of each normalized gene in HC11 cells transfected with scrambled siRNA. Technical replicates were performed in triplicate, with error bars indicating SEM.

