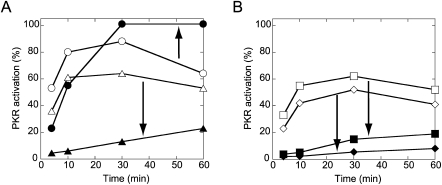
FIGURE 5.
Effect of ionic strength and time on PKR activation by various helical defects. Time points were collected at 4, 10, 30, and 60 min. Different ionic strengths are shown with open (50 mM KCl) or filled (100 mM KCl) symbols. (A) Plot of PKR activation versus time for 0.02-μM dsRNA-51 (○,•) and bent D (△,▴). (B) Plot of PKR activation versus time for 0.02-μM cis 2 (□,▪) and trans 2 (⋄,♦). Percent PKR activation is normalized to 0.01-μM dsRNA-79 RNA. Arrows depict the effect of increasing ionic strength. Gels are provided in Supplemental Fig. S3.

