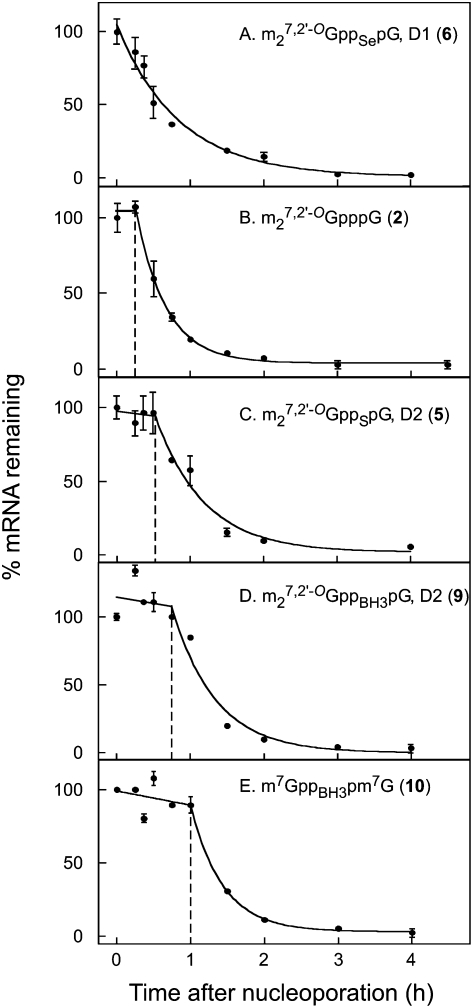
FIGURE 3.
Decay of luciferase mRNA terminated by various cap analogs in HeLa cells. Luciferase mRNAs were synthesized in the presence of the indicated cap analogs and delivered into HeLa cells by nucleoporation as described in Materials and Methods. Cells were lysed at the indicated times and luciferase mRNA was measured by qRT-PCR. Data in panels A–E are plotted as a percentage of the luciferase mRNA present immediately after nucleoporation. In panels B–E, there is a lag before the initiation of rapid decay. The data for the post-lag period were fit to single-exponential function and the t½ of calculated as described in Materials and Methods. Vertical dashed lines mark the boundary between lag phase and first-order decay phase. The data for each transcript represent a single experiment. The error bars represent duplicate luciferase mRNA determinations. The values for replicate experiments are given in Table 2.

