
Figure 1.
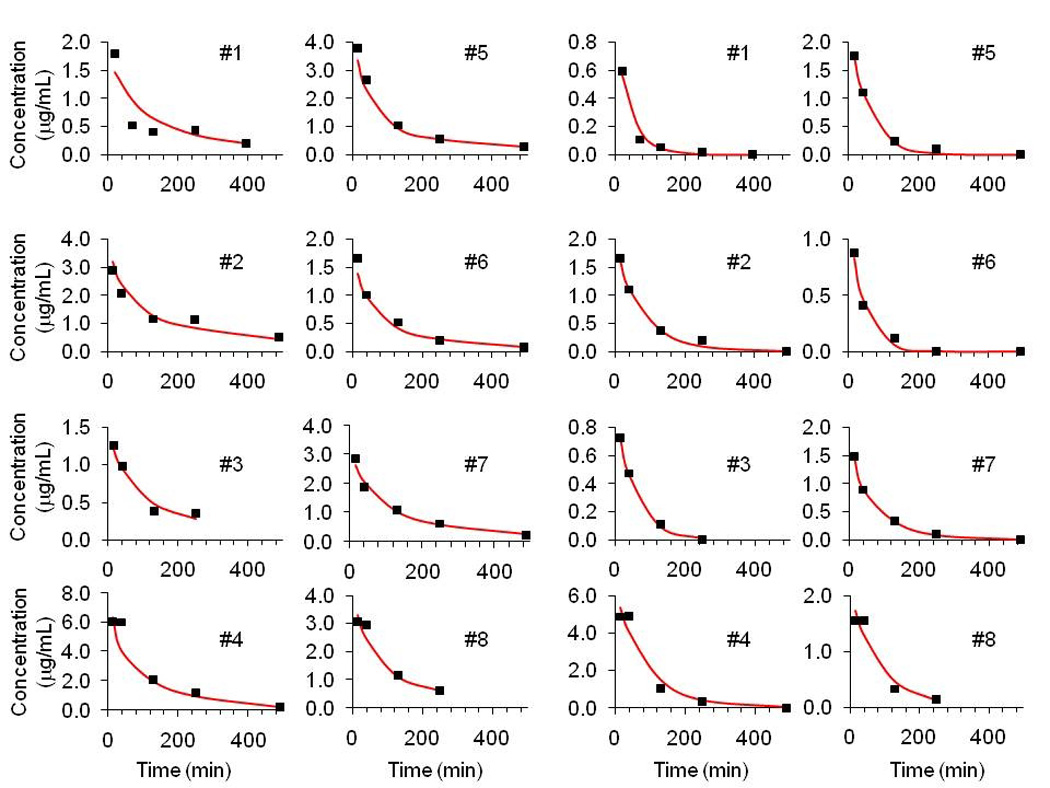
MAP Bayesian individual predictions compared with patient data for R (+) Ketorolac (left) and S (−) Ketorolac (right) plasma concentrations. Note: Patients 4 and 6 received 0.5 mg/kg; Patients 1, 2, 3, 5,7 and 8 received 1.0 mg/kg See Table 2 for individual pharmacokinetic parameters.