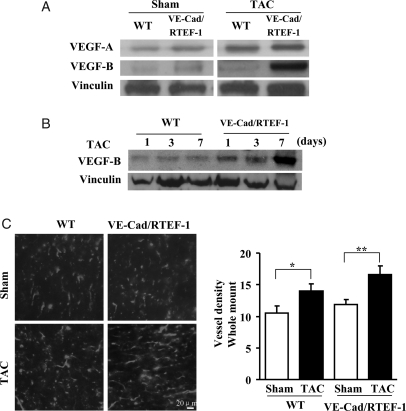
Figure 3.
VEGF-B expression in VE-Cad/RTEF-1 mice after TAC. (A) Western blots of mouse heart lysates showing expression of VEGF-A and VEGF-B in VE-Cad/RTEF-1 or WT mice after TAC or sham treatment. (B) Western blots of VEGF-B in mouse heart lysates from VE-Cad/RTEF-1 mice or WT mice after TAC or sham treatment. (C) Left: sections of mouse heart from VE-Cad/RTEF-1 mice or WT mice after TAC or sham treatment were incubated with lectin antibody to show vessel density. Right: analysis of vessel densities shown in left panels (n = 3). *P< 0.05 and **P< 0.01.

