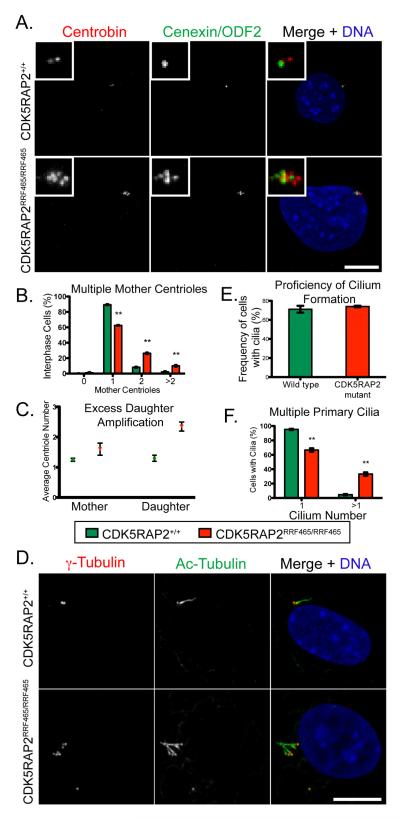
Figure 5.
Supernumerary mother centrioles and primary cilia in CDK5RAP2RRF465/RRF465 MEFs
(A) CDK5RAP2+/+ and CDK5RAP2RRF465/RRF465 MEFs stained with the daughter centriole-specific marker centrobin (left, red in merged panel), the mother centriole-specific marker cenexin/ODF2 (middle, green in merge), and DNA (blue in merge). Insets show enlargements of the centriole region.
(B) Percentages of cells with 0, 1, 2, or greater than 2 mother centrioles in CDK5RAP2+/+ (green bars) and CDK5RAP2RRF465/RRF465 (red bars) cells. MEFs containing 0 mother centrioles (CDK5RAP2+/+: 0.2% ± 0.2% vs. CDK5RAP2RRF465/RRF465: 1.2% ± 0.7%, p>0.05), 1 mother centriole (CDK5RAP2+/+: 89.3% ± 0.7% vs. CDK5RAP2RRF465/RRF465: 62.5% ± 0.5%, p<0.001), 2 mother centrioles (CDK5RAP2+/+: 8.2% ± 0.6% vs. CDK5RAP2RRF465/RRF465: 26.3% ± 0.9%, p<0.0005), or more than 2 mother centrioles (CDK5RAP2+/+: 2.3% ± 0.7% vs. CDK5RAP2RRF465/RRF465: 10.0% ± 1.0%, p<0.005).
(C) Dot plot of the average number of mother (CDK5RAP2+/+: 1.3 ± 0.05 vs. CDK5RAP2RRF465/RRF465: 1.6 ± 0.2) and daughter (CDK5RAP2+/+: 1.3 ± 0.1 vs. CDK5RAP2RRF465/RRF465: 2.4 ± 0.15) centrioles per cell. Data were collected from three independent experiments, 90 cells total.
(D) CDK5RAP2+/+ and CDK5RAP2RRF465/RRF465 MEFs stained for γ-tubulin (left, red in merged panel), the cilium axoneme marker acetylated α-tubulin (middle, green in merge), and DNA (blue in merge). Image in bottom panel shows four cilia in a cell with eight centrioles.
(E) The percent of cells that formed primary cilia in CDK5RAP2+/+ (green bars) and CDK5RAP2RRF465/RRF465 (red bars) MEFs (CDK5RAP2+/+: 71.2% ± 3.6% vs. CDK5RAP2RRF465/RRF465: 74.0% ± 0.9%, p>0.05).
(F) The percent of MEFs forming a single primary cilium (CDK5RAP2+/+: 95.3% ± 0.8% vs. CDK5RAP2RRF465/RRF465: 66.7% ± 2.4%, p<0.005) or more than one primary cilium (CDK5RAP2+/+, 4.7% ± 0.8% vs. CDK5RAP2RRF465/RRF465, 33.3% ± 2.4%, p<0.005). For (B), (E) and (F), data were collected from three independent experiments, n = 200 cells per experiment (except (F), where n = 150 cells with primary cilia per experiment). Scale bar = 10 μm. MEFs in (C-F) were blocked in G1 by serum starvation. See also Figure S5

