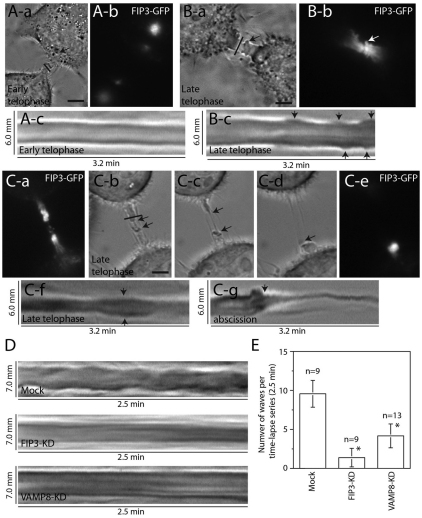
Fig. 2.
Changes in the ICB PM dynamics during telophase. (A,B) HeLa cells expressing FIP3–GFP at different stages of cytokinesis were analyzed by time-lapse microscopy. (Ac,Bc) Kymographs of the ICB (marked by lines in Aa and Ba); arrows mark membrane waves. (C) Time-lapse microscopy analysis of the cell undergoing secondary ingression and abscission. (Ca,Ce) FIP3–GFP localization before (Ca) and after (Ce) abscission. (Cb–Cd) Brightfield images of the cell undergoing a secondary ingression (arrows) and abscission. ICB is marked by the line in Cb. (Cf,Cg) Kymographs of membrane waves (Cf) and abscission (Cg). (D) Time-lapse microscopy analysis of the ‘wave’ formation in cells treated with mock siRNA or with siRNA targeting FIP3 or VAMP8. Images shown are kymographs from the ICB of the late telophase cells. (E) Quantitation of wave formation in cells treated mock siRNA or with siRNA targeting FIP3 or VAMP8. Data shown are means ± s.d. of the number of waves formed within the ICB during each time-lapse series (2.5 minutes long). Asterisks mark the means that are significantly different from mock at P<0.05; n is the number of cells analyzed. Scale bars: 5 μm.

