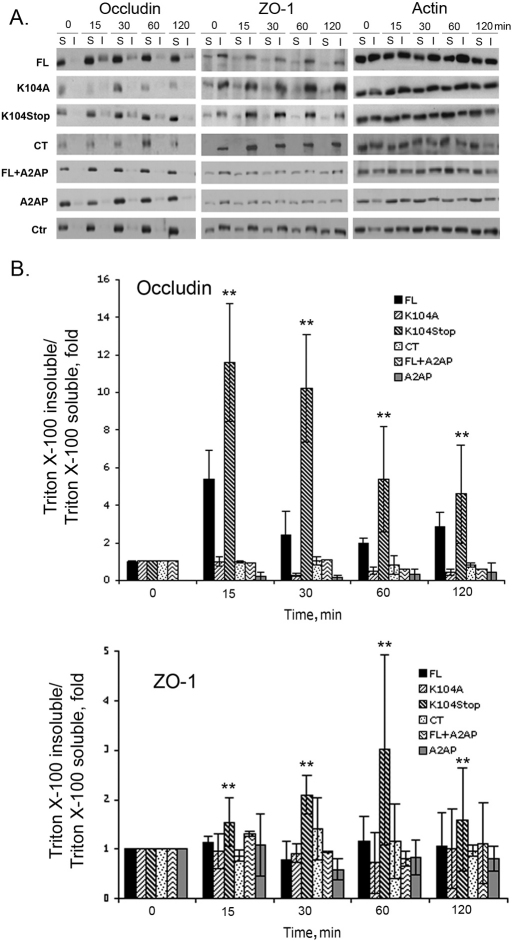
Fig. 4.
Truncated MCP1 shifts TJPs from the Triton-X-100-soluble fraction to the Triton-X-100-insoluble fraction. HBMECs were exposed to the indicated form of MCP1 (100 nM) for different periods of time in the presence or absence of A2AP. Ctr, control (saline). The shift of occludin and ZO-1 from the Triton-X-100-soluble fraction (S) to the Triton-X-100-insoluble fraction (I) was analyzed by western blotting. Actin was used a loading control. (A) Representative images of western blots. (B) Quantitative data from western blots. The intensity of target bands was determined using Scion Image. The intensity of occludin and ZO-1 was normalized to that of actin and the ratios were further normalized to the zero timepoint. Results are means±s.d. (n=3). **P<0.01 (analyzed using one-way ANOVA followed by Newman–Keuls multiple comparison test) for K104Stop-MCP1 compared with FL-MCP1 at each timepoint.

