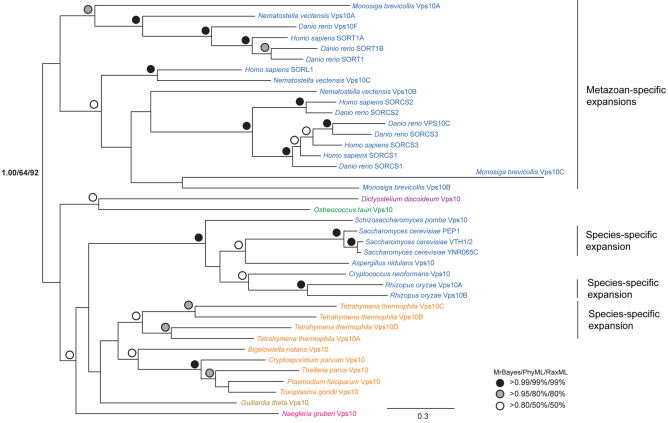
Fig. 8.
Phylogenetic reconstruction of Vps10. The tree shown is the best Bayesian topology. Supergroup colour codes are as for Fig. 1; the numerical values at the nodes of the tree and symbols for highly supported nodes are as in Fig. 2. Species-specific expansions are seen for S. cerevisiae, R. oryzae and T. thermophila, and multiple further expansions originating before individual speciation events are evident in the Metazoa.

