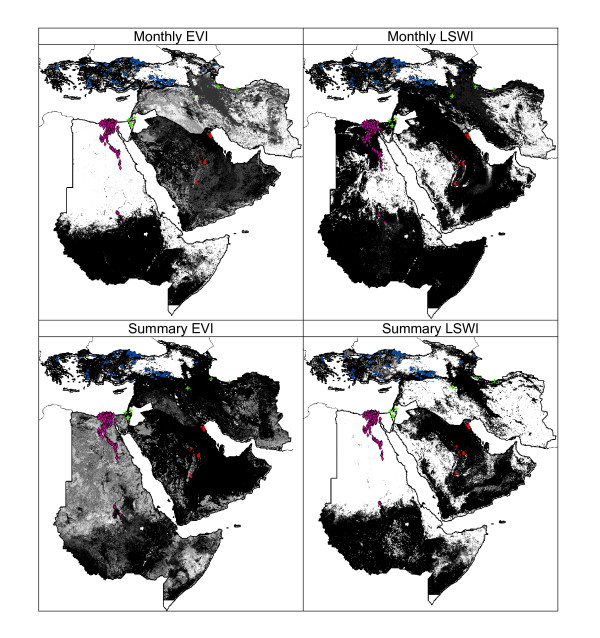
Figure 4.
Among-region model predictions of avian influenza case occurrences for monthly and summary statistic index datasets, and for Enhanced Vegetation Index and Leaf Surface Water Index, in which occurrence data from three regions are used to predict the distribution of case occurrences in the fourth region. Shading indicates model agreement in predictions of presence: white = all models predict absence to black (all models predict potential for presence). In each map, predictions from the four regional predictions are mosaicked. Data used in testing models are shown for each region within the mosaics.

