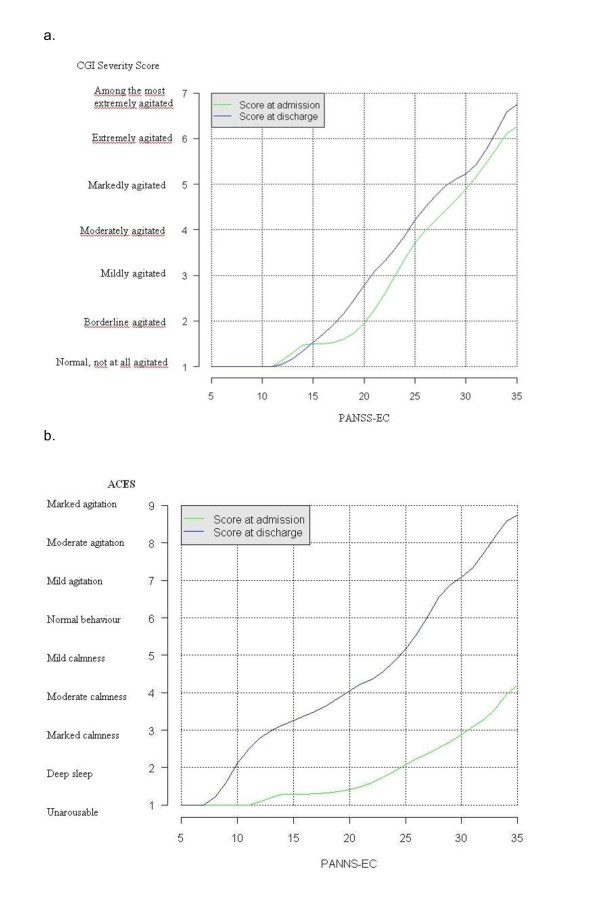
Figure 2.
a. Linking of CGI-S with the PANSS-EC score at admission (green line) and at discharge (blue line). The graph plots the corresponding (real) CGI score for every (integer) PANSS-EC score. For the reverse direction, the intersection of the lines indicates an integer CGI value with the graph providing the corresponding PANSS-EC score. PANSS-EC: Excited Component of the Positive and Negative Syndrome Scale; CGI-S: Clinical Global Impression of Severity. b. Linking of ACES with the PANSS-EC score at admission (blue line) and at discharge (green line). The graph plots the corresponding (real) ACES score for every (integer) PANSS-EC score. For the reverse direction, the intersection of the lines indicates an integer ACES value with the graph providing the corresponding PANSS-EC score. PANSS-EC: Excited Component of the Positive and Negative Syndrome Scale; CGI-S: Clinical Global Impression of Severity.

