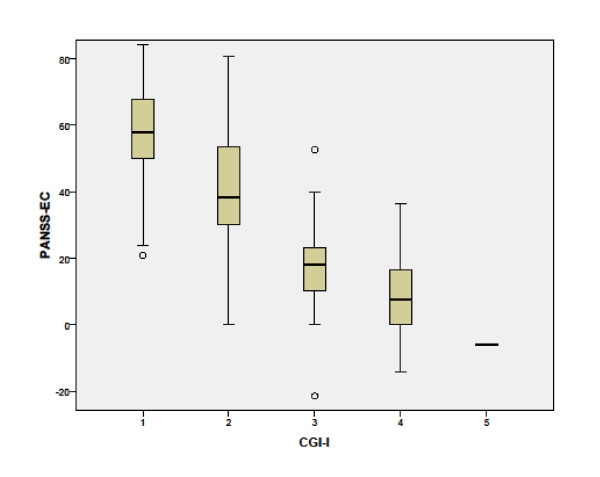
Figure 3.
Distribution of the percentage of reduction in the PANSS-EC score corresponding to CGI-I values from baseline to discharge for all patients (unadjusted data). Box = 25% and 75% quartiles, line = median, whiskers = minimum and maximum values, circles = outliers. PANSS-EC: Excited Component of the Positive and Negative Syndrome Scale; CGI-S: Clinical Global Impression of Severity.

