
Figure 2.
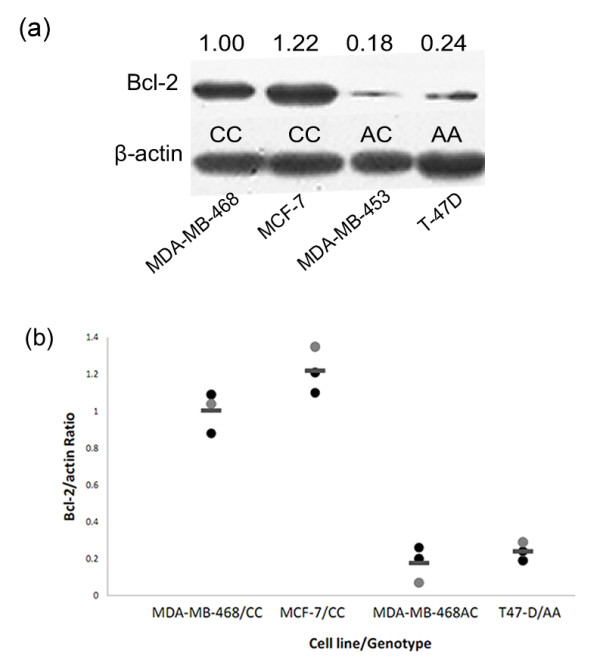
Genotype-dependent expression of Bcl-2 protein in breast cancer cell lines. (a) Effect of BCL-2 (-938C > A) polymorphism on Bcl-2 expression level in breast cancer cell lines. β-actin was used as an internal control and the expression of Bcl-2 protein was quantified as densitometry value analyzed by ImageJ. The figure shown is representative of three independent experiments. (b) Quantitative analysis of protein expression shown in the figure. Densitometry was performed using ImageJ statistical analysis. Statistical analysis was performed using the Student's t test. Horizontal bars represent the mean value of the three values of each cell line/genotype.