Figure 1.

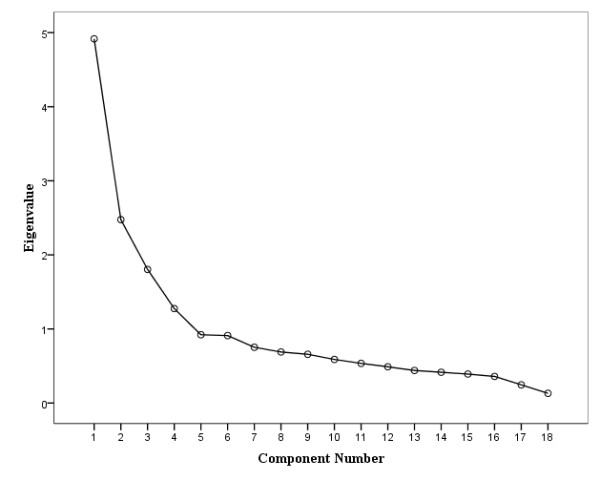
Scree plot of eigenvalues from principal component analysis of physical work factors. A scree-plot reveals the optimal number of components in PCA.

Scree plot of eigenvalues from principal component analysis of physical work factors. A scree-plot reveals the optimal number of components in PCA.